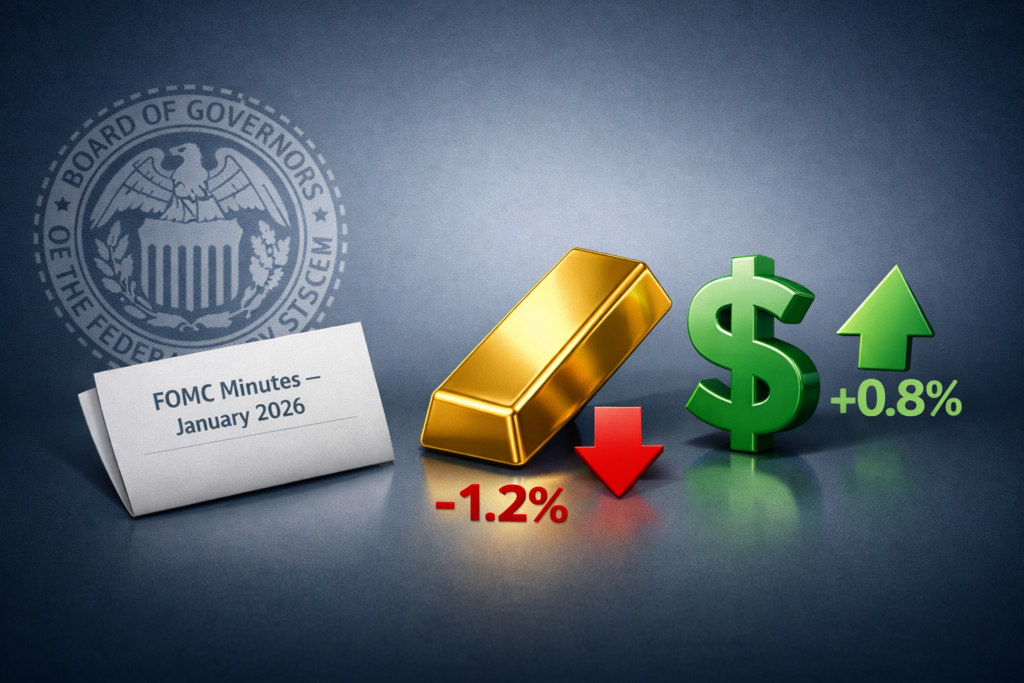
Dhbna Caliber Team

Dhbna Caliber provides in-depth analysis of gold market behavior, psychological trends, and geopolitical shifts. A credible editorial perspective focusing on market sentiment and long-term strategic visions.

A modern balanced financial scale with a gold bar on one side and a concrete dollar symbol on the other, symbolizing balance and correction in the global gold market

Global Gold Market: A Picture of Correction and Calm

The international gold market is currently navigating a period of limited, sideways movement, indicative of a broader corrective phase following a previous downturn. This quiet performance unfolds against a backdrop devoid of immediate, high-impact economic catalysts, fostering a palpable mood of anticipation and observation among market participants. At present, the precious metal’s trajectory is being […]

A 1-kilogram gold bar in the foreground with a financial trading screen showing a sideways gold price chart and a highlighted $5000 level in the background, subtle US dollar elements

Gold Market Navigates a Quiet Phase Amid Economic Anticipation

The global gold market demonstrated a period of subdued volatility on Tuesday, February 10, 2026. A prevailing sense of cautious anticipation has settled among market participants as they await the release of influential U.S. economic data. This report provides an overview of the market’s current state, its underlying drivers, and the potential pathways forward, reflecting

A high-angle artistic photograph showing an elegant woman's hand holding a minimalist 18k gold ring with a thin chain bracelet and hollow gold earring, set against a dark matte background with soft dramatic side lighting and slightly out-of-focus gold investment pieces in the background

The $5,000 Gold Paradigm: How Record Prices Have Redefined the Global Jewelry Industry

The arrival of gold at the pivotal $5,000 per ounce threshold represents a watershed moment in the history of the “king of metals.” This price level has not only reshaped the strategies of major investors but has also triggered a seismic shift in the dynamics of the jewelry trade, fundamentally altering consumer behavior and traditional

Digital jewelers scale showing a 31.10 g gold ingot in a jewelry shop with a blurred background tablet displaying price fluctuations

Anatomy of the Pricing Gap: Why the Shop Price Diverges from the Screen Price in Times of Crisis

Investors in emerging gold markets, particularly in regions like Egypt, frequently encounter a perplexing question: why does the officially quoted global gold price differ so markedly from the actual price at a local jewelry store? At Dhbna, we posit that this variance is not arbitrary nor the result of manipulation. Instead, it is the logical outcome

A photorealistic gold bar stands solid and centered against a dark, chaotic background of abstract digital charts and glitch effects, symbolizing stability amid information chaos.

The Credibility Crisis: Navigating Gold Market Disinformation in the Digital Age

The global gold market has historically functioned as a decentralized, universal standard of value. However, the modern digital landscape, particularly the democratization of financial information through social media, has introduced a significant and often underestimated risk: the prioritization of viral engagement over analytical rigor. At Dhbna, we observe that the current information ecosystem is increasingly

Gold prices drop by 7.4% with a red arrow indicating the decline, featuring gold bars and coins over a financial chart background

Research Report: Anatomy of a 7.4% Correction: Structural Drivers and Historical Parallels

Executive Summary The gold market experienced a significant technical correction on January 30, 2026, with prices declining by 7.41% in a single session. This sharp drop pulled the price from record highs down to the $4,932.80 per ounce level. The event follows what our research team previously identified as a blow-off phase in the market.

Stacked gold bars and coins with a V-shaped digital chart showing $5.5 trillion market cap swing, illustrating historical volatility and global liquidity analysis.

An Analysis of Historical Volatility in Gold’s Market Cap and Its Structural Implications for Global Liquidity

Executive Summary In the trading sessions of 2026, the market capitalization of gold recorded the largest single-day fluctuation in the history of financial markets, with the price movement gap reaching an unprecedented $5.5 trillion. This report from the Dhbna Caliber research center provides a quantitative reading of this volatility, which in its severity surpassed the

Chart for the Gold Market Analysis at $5,300, showing the 2026 price spike, the blow-off phase, and the new support level.

Gold Market Analysis: Evaluating the “Blow-Off Phase” at the $5,300 Threshold

Executive Summary This Gold Market Analysis at the $5,300 level provides a critical look into the first month of 2026, where the market has entered a period of unprecedented volatility. This report from the Dhbna Research Center analyzes the structural and psychological drivers fueling this rally, focusing on the friction between retail FOMO and institutional stability. Our analysis offers

Scroll to Top