A Historical and Market-Based Reading Without Exaggeration
Direct military confrontations in the Middle East rank among the most powerful catalysts for gold throughout history. This isn’t merely because of the military event itself, but rather due to the uncertainty it generates, energy shocks, and pressure on monetary policy.
This article explains how gold reacts chronologically if a strike from the United States against Iran occurs—based on documented precedents from our gold essentials archive.
First: The Immediate Reaction (Hours to Days)
In the event of a direct strike, markets display a recurring pattern:
- Safe-haven rush into gold
- Institutional and hedge fund entries
- Forced short covering across positions
Historical Precedents with Numbers:
| Event | Date | Gold Movement | Timeframe |
|---|---|---|---|
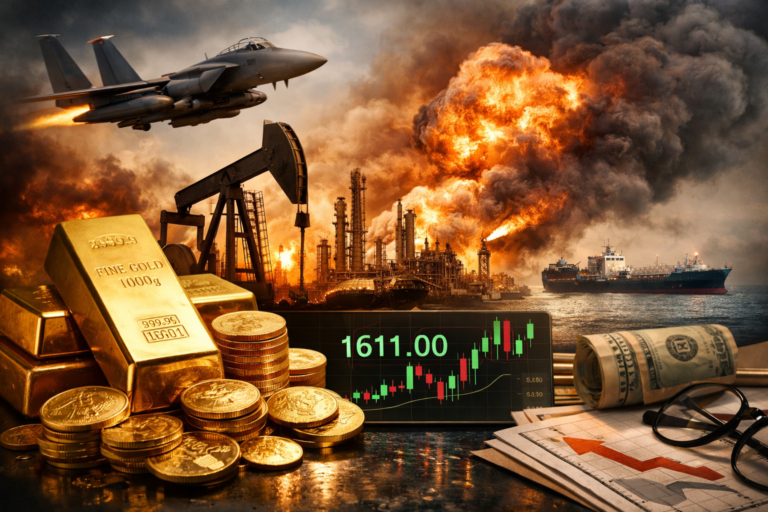
| Qasem Soleimani Assassination | January 3, 2020 | +2.7% to ~$1,611/oz | 48 hours |
| Gulf War Outbreak | August 1990 | Rapid gains | First weeks |
| Strait of Hormuz Tensions | 2019 | Sustained support | Multiple sessions |
Key Takeaway: The initial response is swift and instinctive. The jump typically ranges between 2% and 5% in sudden shocks, potentially exceeding that if the event is large-scale.
Second: The Oil Factor—The Hidden Multiplier
Iran is directly linked to the Strait of Hormuz, through which approximately 20% of global oil trade passes.
The transmission mechanism works as follows:
textThreat to shipping => Higher oil prices => Global inflation => Supportive environment for gold
A Documented Example:
During the 2019 Gulf navigation tensions, Brent crude jumped more than 10% in short sessions, while gold maintained a supportive trend as risks escalated.
This channel (Oil → Inflation → Gold) makes the rise more stable than a mere news-driven reaction—a pattern we frequently document in our research archives.
Third: The Following Days—Does the Rise Continue?
The trajectory depends on the shape of escalation:
| Scenario | Gold Behavior | Duration |
|---|---|---|
| Limited strike + Quick containment | Jumps first, then partially calms, but stays above pre-event levels | Days to weeks |
| Mutual escalation / Regional expansion | Extended wave, increased central bank purchases, historical highs tested | Weeks to months |
Fourth: Monetary Policy—The Invisible Factor
In a major geopolitical shock scenario:
- The Federal Reserve’s ability to tighten diminishes
- Rate hike talk weakens
- Easing tone may accelerate if the shock coincides with stagflation risks
The Market Result:
- Bond yields tend to decline
- The dollar fluctuates
- Gold benefits from lower opportunity cost
This monetary dimension often gets overlooked, yet it remains crucial for understanding sustained gold movements.
Is There a Scenario Where Gold Falls After a Strike?
Rare, but possible only if:
- The strike is highly symbolic with immediate containment announced
- A rapid diplomatic settlement follows
- The event was fully priced in beforehand (unlikely in military events)
Historically, the first wave of major military tension rarely disappoints gold.
Summary Table: Three Channels Supporting Gold
| Channel | Mechanism | Impact Speed |
|---|---|---|
| Safe Haven | Fear-driven institutional buying | Immediate (hours) |
| Oil & Inflation | Supply disruption → price pressure | Short-term (days-weeks) |
| Monetary Constraint | Fed flexibility reduced | Medium-term (weeks-months) |
Final Archival Summary
A U.S. strike on Iran constitutes a strongly supportive event for gold through three interconnected channels:
- Immediate safe-haven demand
- Oil-driven inflation pressures
- Constraints on monetary tightening
The strength and continuity of any rise are determined by the scope and duration of escalation.
At Dhbna, we place scenarios within their historical and market framework. We distinguish between the initial shock and the subsequent path—explaining mechanisms rather than chasing headlines.