Executive Summary
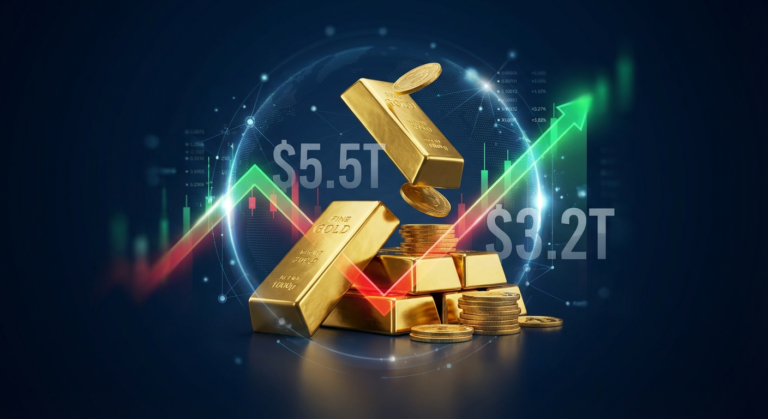
In the trading sessions of 2026, the market capitalization of gold recorded the largest single-day fluctuation in the history of financial markets, with the price movement gap reaching an unprecedented $5.5 trillion. This report from the Dhbna Caliber research center provides a quantitative reading of this volatility, which in its severity surpassed the 2008 financial crisis. We will analyze its impact on the global investment landscape and the structural shifts it signifies. At Dhbna Caliber, our mission is to provide independent and objective analysis to empower investors and researchers.
I. Quantitative Analysis of “The Golden Hour”
Markets witnessed an extraordinary hour in which the precious metal shed approximately $3.2 trillion of its total market value. This momentary contraction, which translates to a liquidity drain of about $58 billion per minute, did not last. The market swiftly moved to restore balance, reclaiming $2.3 trillion in value before the session’s close. This pattern of sharp, V-shaped price action reflects a fierce battle between major sovereign institutions and speculators around strategic support levels, a topic we continuously monitor in our Gold Price Analysis section.
| Metric | Value |
|---|---|
| Initial Market Cap Loss | $3.2 Trillion |
| Value Recovered | $2.3 Trillion |
| Net Daily Swing | $5.5 Trillion |
| Rate of Decline | ~$58 Billion / Minute |
II. Structural Comparison with Digital Assets (Bitcoin)
To place this event in a comparative context, the magnitude of the movement in gold’s market cap was more than three times the entire market cap of Bitcoin during its most volatile 6.5-hour cycle, which peaked at a rate of approximately $850 billion per hour. These figures underscore that gold’s market depth, despite its vastness, was subjected to unprecedented trading pressures. This makes the comparison between gold and high-risk digital assets an urgent necessity for understanding the current inflection point in the global monetary system.
| Asset | Single-Day Swing (Market Cap) | Comparative Scale |
|---|---|---|
| Gold | $5.5 Trillion | 3x Bitcoin’s Peak Value |
| Bitcoin | ~$0.85 Trillion (Peak Cycle) | ~15% of Gold’s Swing |
III. Historical Context: 2008 Crisis vs. 2026 Reality
Registered data at Dhbna Caliber indicates that the current Gold Market Cap Volatility 2026 has substantively surpassed the stress levels seen during the 2008 Global Financial Crisis. The nature of the two events, however, is fundamentally different.
| Aspect | 2008 Financial Crisis | 2026 Market Event |
|---|---|---|
| Primary Driver | Credit market collapse and a sudden, desperate flight to liquidity. | Comprehensive re-evaluation of all asset classes. |
| Causative Factors | Systemic failure in the banking and mortgage sectors. | Geopolitical inflation and strategic shifts in central bank reserves. |
| Market Response | A rush to safe havens (including Gold) out of fear. | A “price discovery” war between long-term holders and short-term speculators on Gold’s true value. |
IV. Trading Opportunities and Strategic Considerations
From a research perspective, these fluctuations represent one of the most significant historical trading opportunities for institutions that employ arbitrage and long-term hedging strategies. However, such an environment demands an unwavering commitment to risk management protocols. A thorough understanding of the Gold Essentials is no longer optional but a prerequisite for any market participant. The volatility underscores the necessity of a disciplined approach to capital allocation and position sizing.
Research Summary & Conclusion
The recording of a $5.5 trillion fluctuation in a single day is not merely a statistical anomaly; it is a clear signal of a new phase of “price discovery” in the gold market. We are facing a new reality characterized by immense liquidity that is, however, extremely sensitive to macroeconomic news and geopolitical shifts. This event confirms that while gold remains a cornerstone of the financial system, its path forward will be defined by a higher volatility threshold than previously understood.
For further inquiries regarding the quantitative data presented in this report, you may reach out to our team via the Contact Us page. We affirm our commitment to data protection as outlined in our center’s Privacy Policy.