Executive Summary
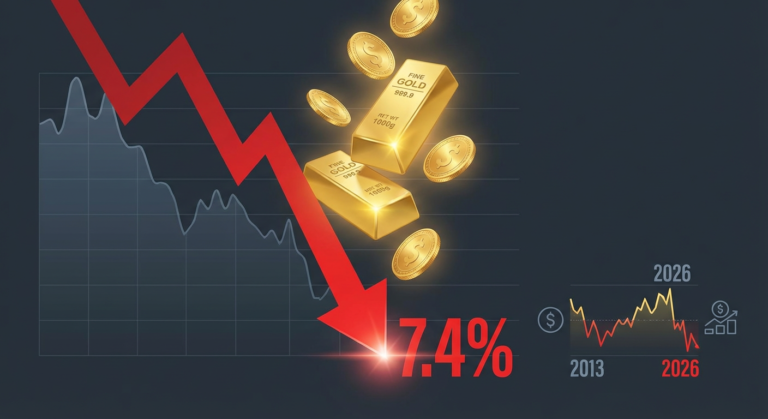
The gold market experienced a significant technical correction on January 30, 2026, with prices declining by 7.41% in a single session. This sharp drop pulled the price from record highs down to the $4,932.80 per ounce level. The event follows what our research team previously identified as a blow-off phase in the market. This report provides a deep-dive analysis of the macro-economic and structural drivers behind this sell-off, drawing critical comparisons to historical market turning points to offer a strategic perspective.
1. Economic and Structural Causes of the Retracement
A decline of this magnitude is rarely attributable to a single factor. Rather, it was the result of a confluence of institutional selling pressures that dismantled the market’s recent upward momentum.
- Profit-Taking at Historical Peaks: After touching the psychological $5,300 level, a coordinated wave of profit-taking was initiated by large investment funds. This move was designed to crystallize gains after a significant rally, and the subsequent selling pressure broke the first critical level of psychological support.
- Cross-Asset Liquidity Crisis (Margin Calls): Amid high volatility in other asset classes, institutional investors often face urgent margin calls. In such scenarios, gold, being one of the most liquid assets, is frequently sold to raise cash. This dash for cash is not a reflection of gold’s fundamentals but rather its utility as a source of emergency liquidity. For a deeper understanding of these dynamics, a review of gold essentials is recommended.
- Resurgence of the U.S. Dollar: An unexpected improvement in bond yields, coupled with a more hawkish monetary policy stance, increased the opportunity cost of holding non-yielding assets like gold. This macroeconomic shift provided a strong headwind, prompting a rebalancing of portfolios.
2. Historical Precedents and Cyclical Patterns
History provides a valuable lens through which to view today’s volatility. Our ongoing gold price analysis shows that the metal has weathered similar storms under comparable economic conditions, offering strategic lessons for the long-term investor.
- The 2008 Financial Crisis: Although gold is a safe haven, it lost approximately 25% of its value during the peak of the 2008 crisis due to a desperate need for cash. Once the liquidity crunch subsided, gold began a historic rally to new highs.
- The April 2013 Flash Crash: In April 2013, gold recorded its largest single-day percentage drop in 30 years, falling over 9% in one session. The catalyst was a sudden shift in macroeconomic expectations.
- The COVID-19 Shock (March 2020): In a pattern similar to 2008, gold fell sharply alongside collapsing equity markets as investors sold it to provide immediate liquidity, before aggressively rebounding once the initial panic passed.
Comparative Analysis: 2013 vs. 2026 Corrections
To provide a clearer context, the following table compares the key attributes of the April 2013 crash and the January 2026 correction.
| Metric | April 2013 Flash Crash | January 2026 Correction |
|---|---|---|
| Single-Day Decline | ~9.1% | ~7.4% |
| Primary Catalyst | Shift in Fed policy expectations; Cyprus “bail-in” fears | Institutional profit-taking; Cross-asset margin calls |
| Preceding Market Phase | Post-QE rally, with growing disinflationary signs | Blow-off top phase with high retail participation |
| Market Psychology | Panic selling, fear of central bank gold sales | Technical deleveraging, institutional rebalancing |
3. Behavioral Analysis: The Blow-Off Phase Culmination
Today’s 7.4% decline aligns perfectly with the blow-off phase hypothesis previously outlined by the Dhbna Caliber team. This phase is characterized by a parabolic price rise driven by intense public participation and fear of missing out. Once this sentiment reaches its zenith, the market becomes structurally fragile. This decline represents a necessary rebalancing to purge excessive speculation and reconnect the price with its fundamentally supported fair value.
4. Research Outlook for the Coming Phase
Based on our fundamental metrics, this type of correction is considered healthy within a long-term bull market. Our team is now closely monitoring the $4,800 to $4,900 range as a key technical pivot. The market’s ability to consolidate here will be a critical indicator of its medium-term directional bias. As an independent research center, we feel it is our responsibility to provide objective analysis, a mission you can learn more about us and our principles.
Summary of Research Findings
The 7.4% single-day loss in gold’s value is not a fundamental collapse but a technical correction. Historical precedent shows that gold often emerges from these sharp downturns with a more resilient investor base. The key is understanding institutional liquidity dynamics. While market volatility can be unsettling, it can also be a time to ensure all aspects of one’s holdings are in order, right down to the physical maintenance and jewelry care for tangible assets.
We are committed to the highest standards of transparency, as detailed in our privacy policy. For further inquiries or to discuss our findings, do not hesitate to contact us.